Appendix: phosphorus mobilisation upon rewetting
Background
The project OP-PEIL investigates Controlled Drainage (CD) as one of the tools to obtain a more sustainable water management for and by agriculture in Flanders. One of the objectives is to monitor the effect of controlled drainage on salinization in the polder context. Indeed, in the past polders were submerged at high tide by the sea, which is the origin of the salinity of its current groundwater. By building dikes such transgression were prevented and using an ingenious network of ditches, these lands gained on the sea could be drained to make them suitable for agriculture. With time and rainfall, a superficial (few meters) thick freshwater lens, less dense than the saline water below, developed. This freshwater lens is essential for crops, as most common crops would suffer from direct contact with the saline water. However, as precipitations become more intense, rainfall has less time to infiltrate and to recharge the freshwater lens and is often directly evacuated by the drainage system in place. With more frequent summer drought, this problem become even more acute and can lead to the disappearance of the freshwater lens and the uprising of the saline water to the root zone, endangering yield.
In a controlled drainage setup, a farmer is able to regulate the water table in his/her field according to the meteorological conditions and planned field work by adjusting the water level in a control pit at the drainage outlet. In the polder context, controlled drainage helps to infiltrate more freshwater in the soil during winter to maintain the freshwater lens and push down the saline/freshwater interface.
In the framework of this project, two neighboring experimental fields in the polders were selected to monitor the effects of controlled drainage on the water table and hydrological functioning of the fields. From April 2021 to November 2022 both fields were conventionally drained and monitored. Starting in December 2022, one of the fields was equipped with a controlled drainage pit, whereas the other served as a reference for conventional drainage. Both fields are equipped with various sensors to monitor the water table, soil moisture, soil temperature and soil electrical conductivity at various location in each field.
Given the high level of instrumentation and control, these fields present a unique opportunity to monitor whether phosphorus (P) is mobilized with increasing groundwater levels (GWL) by measuring P content in water samples taken from the drainage pipes and in soil samples. The experimental setup and first results are described below. However, 2022 was exceptionally dry and just three water samples could be taken before the end of this project (no outflow drainage during summer). In this chapter, the first experimental data regarding nutrient concentration in the soil, and GWL dynamics is presented. ILVO will continue the monitoring of phosphorus concentrations in the drainage water in the coming 2 years.
Methodology
Experimental site
The two experimental fields, a regularly drainage (RD) and a controlled drainage (CD) fields are located in Middelkerke (51° 8’ 23.26" N, 2° 48’ 51.86" E) and are part of the same farm (Figure 1). In each field, three locations (CD1, CD2, CD3 or RD1, RD2, RD3) were equipped with three piezometers of different lengths (150, 200, and 300 cm below surface), one stick of 16 electrodes to measure the soil electrical conductivity, and soil moisture and temperature sensors. Field monitoring included groundwater level and electrical conductivity (EC) measurements of the groundwater in these six locations. Manual measurements of piezometric heads were taken monthly since March 2022 and automated divers (DL-CTD10, Decentlab) were installed in four piezometers (CD1, CD2, RD1, and RD2) since July 2022. Soil samples were taken in each field on March 28th, 2022, to analyze their chemical composition and characteristics.
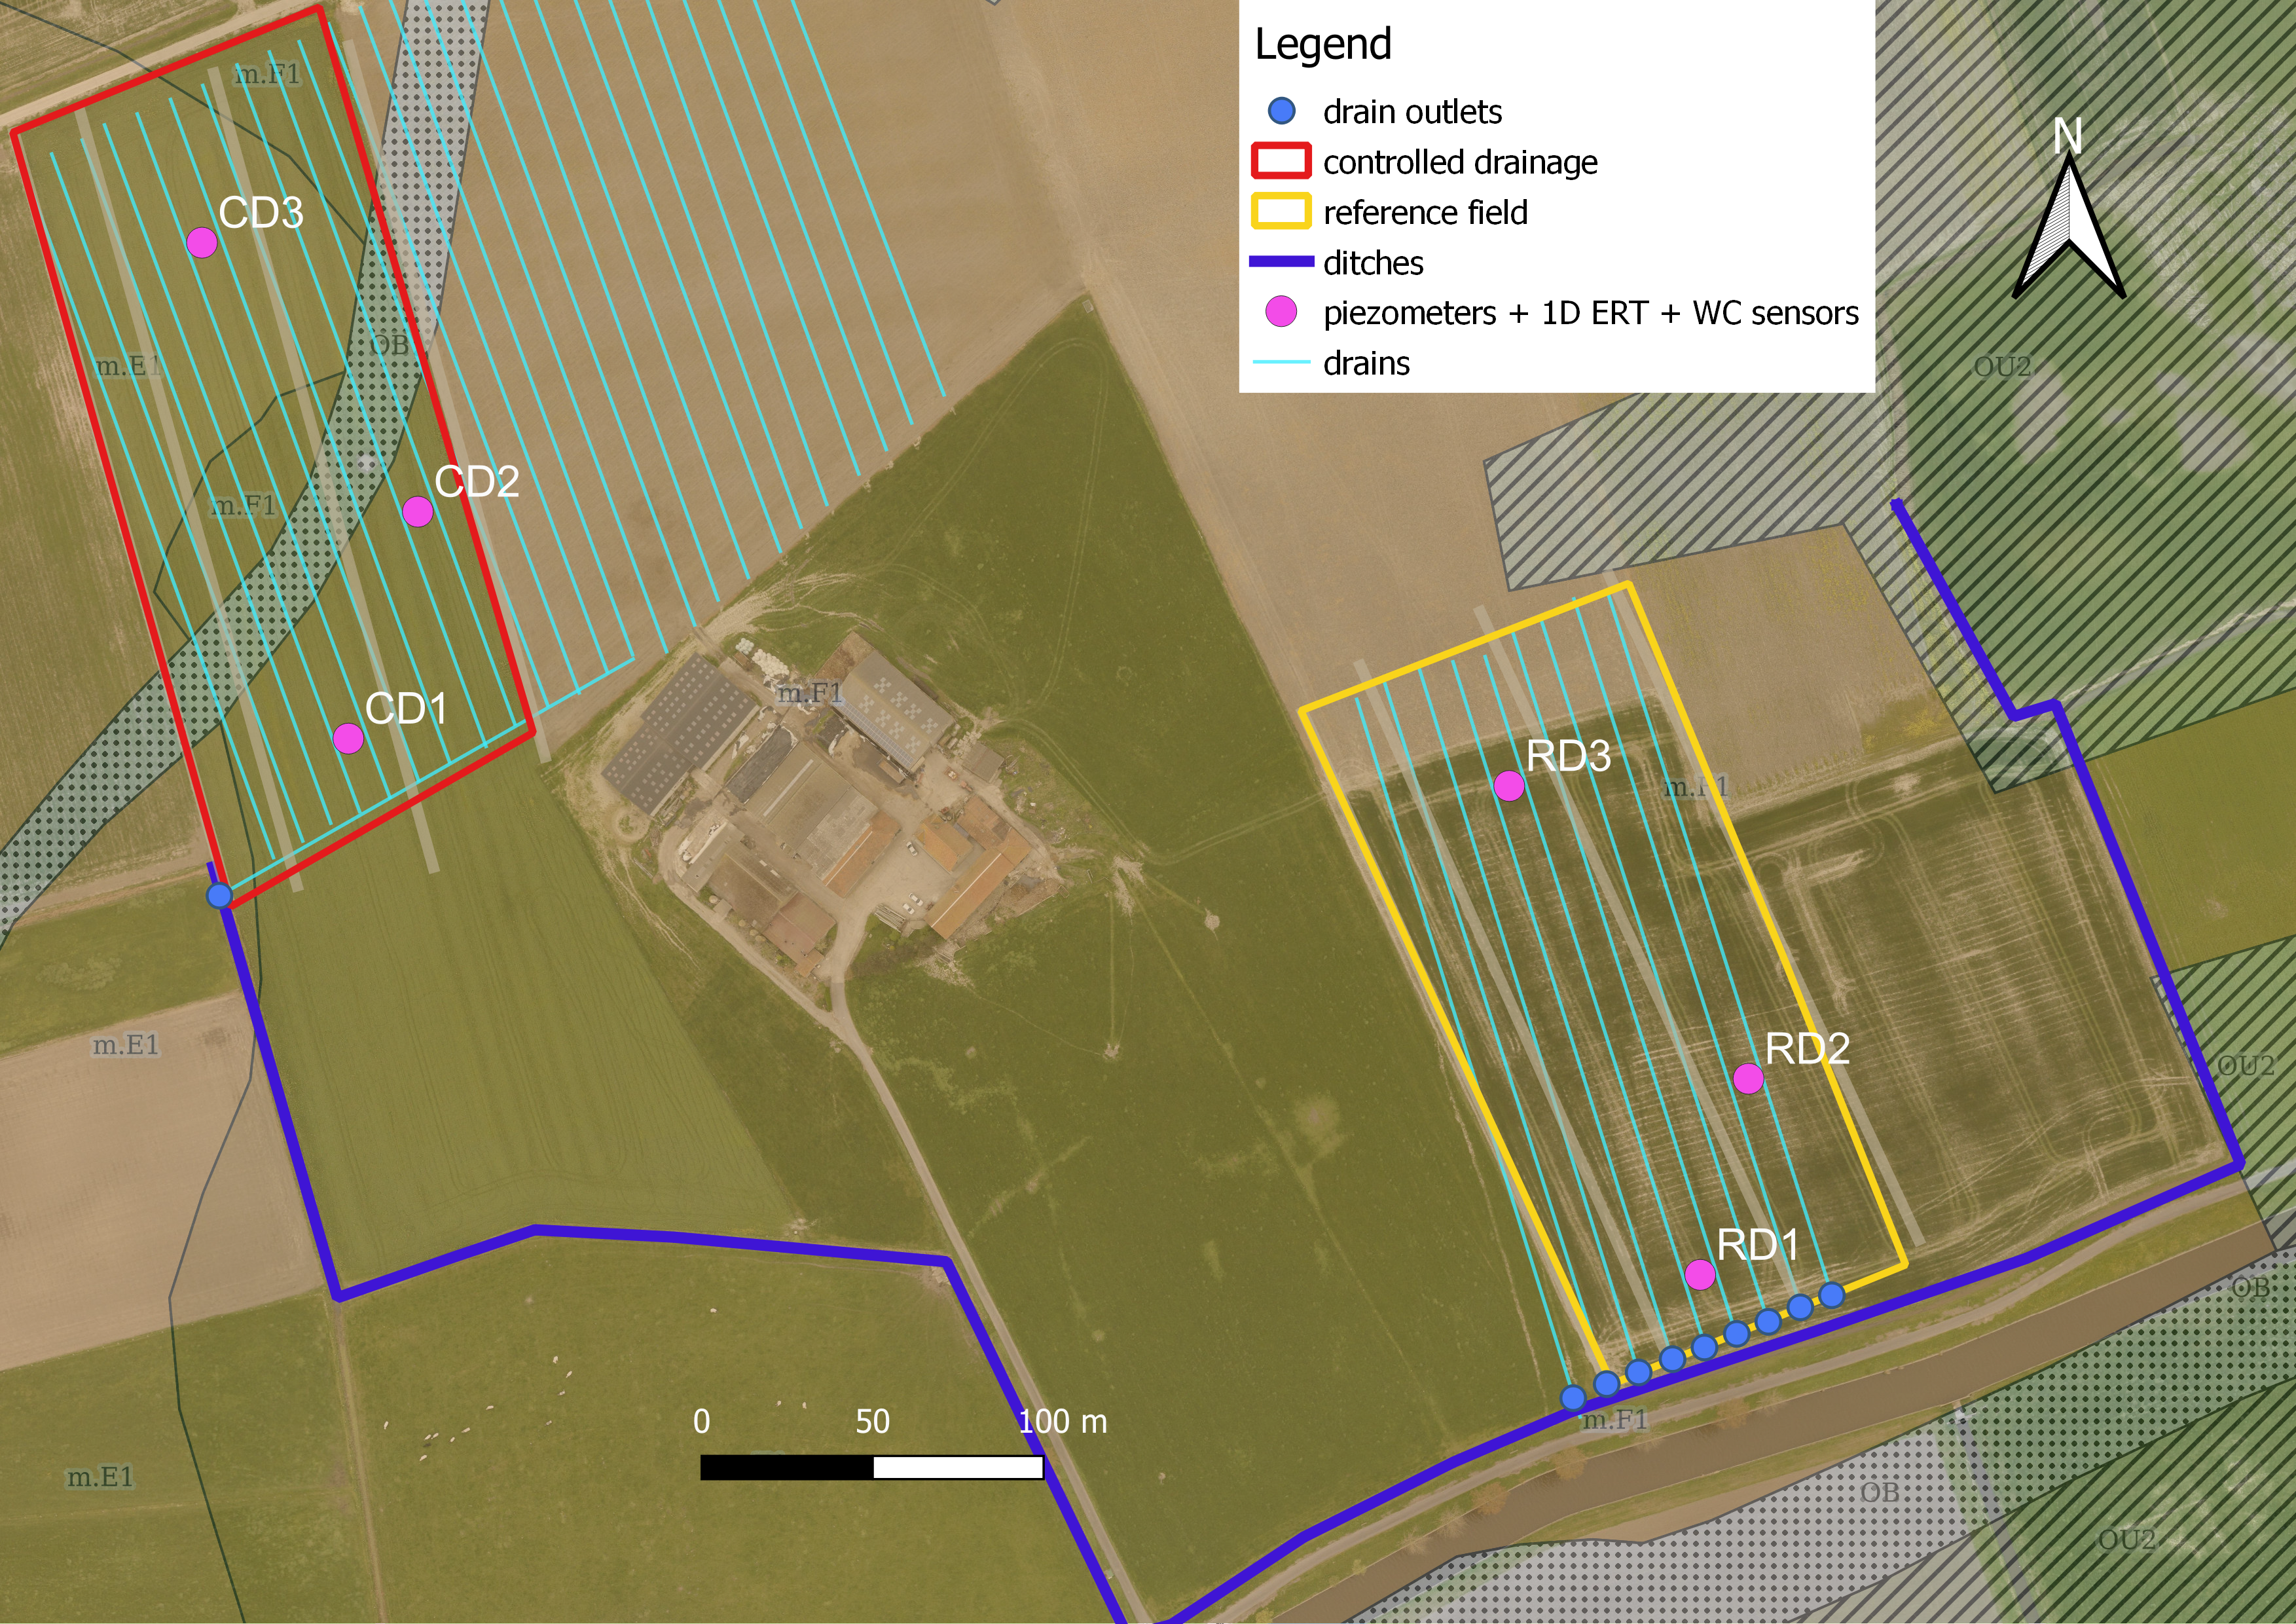
Figure 1:Location of the experimental fields, along with the position of each measuring point and the drainage pipes. In transparent overlay is the soil type according to the Belgian soil map.
From the borehole logs of the piezometers, we deduced the soil profiles on each measuring point (Figure 2). The soil is characterized by an agricultural horizon (Ap) of about 0.45 m corresponding to the plowing depth, followed by a consolidated clay layer (hard clay) that sometimes can reach a depth of 3 m, and below either a sandy soil layer or a peat layer. It can be seen that the peat layer can be about 1 m thick in some locations.

Figure 2:Soil profiles on each measuring point. The depth of the soil profiles is expressed in meters above sea level (masl).
In the first year of experiments (2022), winter flax was sown in the controlled drainage (CD) field, while in the regular drainage field (RD), grass for seed production (RD1 and RD2) and a combination of winter wheat plus beans were planted (RD3). By the end of 2022, the new growing cycle consisted on winter wheat in the CD field and grass for RD1 and RD2 and winter flax for RD3. The specific plowing, planting and harvesting dates for each crop, and expected harvesting dates in 2023, are summarized in Table 1.
Table 1:Agricultural practices in the reference and controlled drainage fields during the experiments. Bold numbers denote expected harvesting dates. Note that flax is first cut down (“harvest” event) and then left on the surface for retting until collected (“collection” event).
Field | Crop | Event | Date |
|---|---|---|---|
RD | Winter wheat + beans | sowing | 15/11/2021 |
RD | Grass | sowing | 20/11/2021 |
CD | Winter flax | sowing | 25/11/2021 |
RD | Grass | cut | 01/04/2022 |
RD | Grass | seed harvest | 07/07/2022 |
CD | Winter flax | harvest | 20/06/2022 |
CD | Winter flax | collection | 12/08/2022 |
RD | Winter wheat + beans | harvest | 12/08/2022 |
RD | Grass | cut | 01/10/2022 |
CD | Winter wheat | plowing | 20/09/2022 |
CD | Winter wheat | sowing | 10/10/2022 |
RD | Winter flax | sowing | 10/10/2022 |
CD | Winter wheat | harvest | 01/07/2023 |
RD | Winter flax | harvest | 01/08/2023 |
RD | Grass | harvest | 01/10/2023 |
Weather conditions and groundwater levels
Figure 3 shows the precipitation and cumulative precipitation deficit (precipitation - reference evapotranspiration, P-ET0), and the average groundwater level depths, in reference to the surface, measured in the experimental site during the year 2022 and start of 2023. In Figure 3A, the orange dashed line represents the date where the soil samples were collected from the field (28/03/2022) and the black dashed lines shows the dates when the water samples were taken from the drainage pipes (05/07/2022 and 02/12/2022). In Figure 3B, the black dashed line shows the date when the controlled drainage system was installed in the CD field, where the water level is tried to keep stable to a level of around 25 cm below the soil surface.
A dry period occurred in August - September 2022 when the precipitation deficit was over 200 mm. The precipitation deficit decreased in the next months due to more rainfall and lower temperatures, reaching a precipitation surplus of 100 mm in January 2023. This can be noted in the shallower groundwater levels in the CD and RD fields. The groundwater level is higher in the CD field, especially during the drier months. In general, the water table stays above 100 cm during winter but sometimes becomes very shallow. According to the raw measurements, water levels even reached the ground level on 12/01/2023.

Figure 3:Daily precipitation, cumulative precipitation deficit (precipitation - reference evapotranspiration, P-ET0) (A), and average groundwater level, in reference to the surface, measured in the experimental site (B). The orange dashed line on the top figure (A) represents the date where the soil samples were collected (28/03/2022) and the black dashed lines shows the dates when the water samples were taken from the drainage pipes (05/07/2022 and 02/12/2022). In the bottom figure (B), the black dashed line shows the date when the controlled drainage system was installed in the CD field.
Soil and water sampling and analyses
The methods for sampling preparation and further analysis, applied by the ILVO Eenheid Plant Laboratorium Teelt en Omgeving, are described below.
Soil samples
Soil samples were collected on 28/03/2022 from soil layers 0-30 cm, 30-60 cm and 60-90 cm in both fields. The samples were put in plastic bags and stored at -20 °C until they could be analyzed on 29/08/2022.
Soil sample preparation
Visual plant and roots >2 mm were removed from the moist sample. The soil was dried for at least 24 h at 40 +/-2 °C. The sample was grounded with a jaw crusher (crushers at 1.5 mm) and sieved at 2 mm. Material that not passed the sieve was crushed manually in a mortar and again sieved at 2 mm.
Ammonium Lactate
Ammonium lactate extractable phosphorous (P), calcium (Ca), magnesium (Mg) and potassium (K) (P-AL, Ca-AL, Mg-AL and K-AL) were assessed by extraction of the soil with 0.1 M ammonium lactate and 0.4 M acetic acid at pH 3.75 (extraction ratio 1:20) in dark polyethylene bottles, shaken for 4 h and the suspension was filtered in dark polyethylene bottles that were stored cool (4 °C) until analysis. P-AL, Ca-AL, Mg-AL and K-AL were analyzed by a 5110 VDV Agilent ICP-OES (Agilent, Santa Clara, CA).
Oxalate - phosphate saturation degree (FVG, fosfaatverzadigingsgraad)
Oxalate extractable P, aluminum (Al) and iron (Fe) were assessed by extraction of the soil with 0.2 M ammonium oxalate and 0.14 M oxalic acid at pH 3 (extraction ratio 1:20) in dark polyethylene bottles, shaken for 2 h and the suspension was filtered in dark polyethylene bottles that were stored cool (4 C) until analysis. P, Fe and Al were analyzed by a 5110 VDV Agilent ICP-OES (Agilent, Santa Clara, CA).
The FVG, expressed in %, is calculated based on the phosphate binding capacity (FBV, fosfaatbindend vermogen) in mmol P kg -1air dry soil, as follows:
Water samples
Water samples from the drainage pipes were collected in polyethylene tubes on 07/05/2022 and 02/12/2022. They were stored at -20 °C until they could be analyzed. The total phosphorous concentration was measured in filtered and unfiltered samples. The water samples were filtered using a paper filter of 0.45 µm to evaluate whether some P was attached to colloids. Both set of samples (filtered and unfiltered) were analyzed by a 5110 VDV Agilent ICP-OES (Agilent, Santa Clara, CA).
Results: Phosphorous measurements
Table 2 contains P-AL, the measured phosphorous (P) content in the soil that is available for crops on the long term (smaller than the total soil phosphorus concentration). P-AL contents in the soil were higher in the top 30 cm of the soil. P was almost 50 mg/100 g DS at 0-30 cm depth in both fields, and it decreased until 25 mg/100 g DS and 11 mg/100 g DS in the CD and RD fields, respectively at 30-60 cm depth. The values in the top 30 cm are classified as “high” according to Tits et al., 2020 which specifies that the target should be between 12 and 18 mg/100 g DS.
Table 2:Phosphorus (P) measured by ammonium lactate extraction (AmLact) and Phosphate binding capacity (FVG) at 30 cm, 60 cm and 90 cm, in the CD and RD fields.
Field ID -> | CD | RD | ||
|---|---|---|---|---|
Sampling depth | P-AL (mg/100g DS) | FVG (%) | P-AL | FVG |
0-30 | 48 | 91 | 49 | 76 |
30-60 | 25.4 | 62 | 11.2 | 50 |
60-90 | 19.6 | 59 | 10.8 | 46 |
As explained in section 3.1 of the chapter Impact of changing groundwater level on nutrient mobility, P has high affinity with clay particles, Fe, Al, and Ca oxides. Under anaerobic conditions, part of the Fe oxides are reduced to soluble forms, which releases the adsorbed phosphorous in the soil solution. The phosphate saturation degree (FVG) in Table 2 is very high, especially in the first 30 cm of the soil. Soils with values above 35 % are considered “phosphate saturated soils” according to the Vlaamse Mestbank and have a risk of P leaching. Since the groundwater level depth remains shallower than 100 cm during a large period of time, anaerobic conditions may occur in large portions of the soil profile and P mobilization may increase. Given the high P concentration and its high FVG, there is a high risk of P mobilization and transport to surface water when the water table is close to the soil surface. This can be further analyzed when more data is available, especially under active water storage using controlled drainage.
Table 3 presents the measured total P, Fe and Al in mg l-1 in three water samples taken from the drainage pipes of the CD and RD fields. The concentration of P in filtered and unfiltered samples are almost the same, which demonstrates that P attached to larger colloids ( > 0.45 µm, particulate P) is very low and most of P is in solution (soluble P) and smaller nanoparticles. Concentrations of P in the drainage water is lower in December 2022 than in May 2022, possibly due to a higher disolution in presence of more soil water. According to Flemish legislations (Vlarem II, appendix 2.3.1) P concentrations in surface water should be below 0.1 mg l-1(general value depending on phosphorus measurement and water body type). In this case, P concentration is sometimes way above the limit, and could be a problem for nearby water sources.
Table 3:Phosphorus concentration in the drainage water of the CD and RD fields.
Date | Location | Soluble P (filtered sample) mg l -1 | Total P (unfiltered sample) mg l -1 |
|---|---|---|---|
07/05/2022 | drain CD | 1.83 | 1.85 |
02/12/2022 | drain CD | 0.64 | 0.63 |
02/12/2022 | drain RD | 0.14 | 0.15 |
- Tits, M., Elsen, A., Deckers, S., Bries, J., & Vandendriessche, H. (2020). Bodemvruchtbaarheid van de akkerbouw- en weilandpercelen in België en Noordelijk Frankrijk (2016-2019) (p. 235) [Techreport]. Publicatie van de Bodemkundige Dienst van België. https://www.bdb.be/nl/kennisbank/uitgaven/bodemvruchtbaarheid-van-de-akkerbouw-en-weilandpercelen-in-belgi%C3%AB-en-noordelijk-frankrijk-2016-2019